5 Sensation and Perception
Imagine standing on a city street corner. You might be struck by movement everywhere as cars and people go about their business, by the sound of a street musician’s melody or a horn honking in the distance, by the smell of exhaust fumes or of food being sold by a nearby vendor, and by the sensation of hard pavement under your feet.
We rely on our sensory systems to provide important information about our surroundings. We use this information to successfully navigate and interact with our environment so that we can find nourishment, seek shelter, maintain social relationships, and avoid potentially dangerous situations.
This chapter will provide an overview of how sensory information is received and processed by the nervous system and how that affects our conscious experience of the world. We begin by learning the distinction between sensation and perception. Then we consider the physical properties of light and sound stimuli, along with an overview of the basic structure and function of the major sensory systems. The chapter will close with a discussion of a historically important theory of perception called Gestalt.
Table of Contents
5.4 The Auditory System
Sensation vs. Perception
Learning Objectives
By the end of this section, you will be able to:
- Distinguish between sensation and perception
- Describe the concepts of absolute threshold and difference threshold
- Discuss the roles attention, motivation, and sensory adaptation play in perception
Sensation
What does it mean to sense something? Sensory receptors are specialized neurons that respond to specific types of stimuli. When sensory information is detected by a sensory receptor, sensation has occurred. For example, light that enters the eye causes chemical changes in cells that line the back of the eye. These cells relay messages, in the form of action potentials (as you learned when studying biopsychology), to the central nervous system. The conversion from sensory stimulus energy to action potential is known as transduction.
You have probably known since elementary school that we have five senses: vision, hearing (audition), smell (olfaction), taste (gustation), and touch (somatosensation). It turns out that this notion of five senses is oversimplified. We also have sensory systems that provide information about balance (the vestibular sense), body position and movement (proprioception and kinesthesia), pain (nociception), and temperature (thermoception).
The sensitivity of a given sensory system to the relevant stimuli can be expressed as an absolute threshold. Absolute threshold refers to the minimum amount of stimulus energy that must be present for the stimulus to be detected 50% of the time. Another way to think about this is by asking how dim can a light be or how soft can a sound be and still be detected half of the time. The sensitivity of our sensory receptors can be quite amazing. It has been estimated that on a clear night, the most sensitive sensory cells in the back of the eye can detect a candle flame 30 miles away (Okawa & Sampath, 2007). Under quiet conditions, the hair cells (the receptor cells of the inner ear) can detect the tick of a clock 20 feet away (Galanter, 1962).
Absolute thresholds are generally measured under incredibly controlled conditions in situations that are optimal for sensitivity. Sometimes, we are more interested in how much difference in stimuli is required to detect a difference between them. This is known as the just noticeable difference (jnd) or difference threshold. Unlike the absolute threshold, the difference threshold changes depending on the stimulus intensity. As an example, imagine yourself in a very dark movie theater. If an audience member were to receive a text message that caused the cell phone screen to light up, chances are that many people would notice the change in illumination in the theater. However, if the same thing happened in a brightly lit arena during a basketball game, very few people would notice. The cell phone brightness does not change, but its ability to be detected as a change in illumination varies dramatically between the two contexts. Ernst Weber proposed this theory of change in difference threshold in the 1830s, and it has become known as Weber’s Law: The difference threshold is a constant fraction of the original stimulus, as the example illustrates.
Perception
While our sensory receptors are constantly collecting information from the environment, it is ultimately how we interpret that information that affects how we interact with the world. Perception refers to the way sensory information is organized, interpreted, and consciously experienced. Perception involves both bottom-up and top-down processing. Bottom-up processing refers to sensory information from a stimulus in the environment driving a process, and top-down processing refers to knowledge and expectancy driving a process, as shown in Figure 5.2 (Egeth & Yantis, 1997; Fine & Minnery, 2009; Yantis & Egeth, 1999).
Imagine that you and some friends are sitting in a crowded restaurant eating lunch and talking. It is very noisy, and you are concentrating on your friend’s face to hear what she is saying. Suddenly, the sound of breaking glass and clang of metal pans hitting the floor rings out. The server dropped a large tray of food. Although you were attending to your meal and conversation, that crashing sound would likely get through your attentional filters and capture your attention. You would have no choice but to notice it. That attentional capture would be caused by the sound from the environment: it would be bottom-up.
Alternatively, top-down processes are generally goal directed, slow, deliberate, effortful, and under your control (Fine & Minnery, 2009; Miller & Cohen, 2001; Miller & D’Esposito, 2005). For instance, if you misplaced your keys, how would you look for them? If you had a yellow key fob, you would probably look for yellowness of a certain size in specific locations, such as on the counter, coffee table, and other similar places. You would not look for yellowness on your ceiling fan, because you know keys are not normally lying on top of a ceiling fan. That act of searching for a certain size of yellowness in some locations and not others would be top-down—under your control and based on your experience.
One way to think of this concept is that sensation is a physical process, whereas perception is psychological. For example, upon walking into a kitchen and smelling the scent of baking cinnamon rolls, the sensation is the scent receptors detecting the odor of cinnamon, but the perception may be “Mmm, this smells like the bread Grandma used to bake for holidays.”
There is another factor that affects sensation and perception: attention. Attention plays a significant role in determining what is sensed versus what is perceived. Imagine you are at a party full of music, chatter, and laughter. You get involved in an interesting conversation with a friend, and you tune out all the background noise. If someone interrupted you to ask what song had just finished playing, you would probably be unable to answer that question. Your attention prevented you from fully processing the information from the song to allow you to process your conversation with your friend.
One of the most interesting demonstrations of how important attention is in determining our perception of the environment occurred in a famous study conducted by Daniel Simons and Christopher Chabris (1999). In this study, participants watched a video of people dressed in black and white passing basketballs. Participants were asked to count the number of times the team dressed in white passed the ball. During the video, a person dressed in a black gorilla costume walks among the two teams. You would think that someone would notice the gorilla, right? Nearly half of the people who watched the video didn’t notice the gorilla at all, despite the fact that he was clearly visible for nine seconds. Because participants were so focused on the number of times the team dressed in white was passing the ball, they completely tuned out other visual information. Inattentional blindness is the failure to notice something that is completely visible because the person was actively attending to something else and did not pay attention to other things (Mack & Rock, 1998; Simons & Chabris, 1999).
In a similar experiment, researchers tested inattentional blindness by asking participants to observe images moving across a computer screen. They were instructed to focus on either white or black objects, disregarding the other color. When a red cross passed across the screen, about one third of subjects did not notice it (Figure 5.3) (Most, Simons, Scholl, & Chabris, 2000).
Our perceptions can also be affected by our beliefs, values, prejudices, expectations, and life experiences. As you will see later in this chapter, individuals who are deprived of the experience of binocular vision during critical periods of development have trouble perceiving depth (Fawcett, Wang, & Birch, 2005). The shared experiences of people within a given cultural context can have pronounced effects on perception. For example, Marshall Segall, Donald Campbell, and Melville Herskovits (1963) published the results of a multinational study in which they demonstrated that individuals from Western cultures were more prone to experience certain types of visual illusions than individuals from non-Western cultures, and vice versa. One such illusion that Westerners were more likely to experience was the Müller-Lyer illusion (Figure 5.4): The lines appear to be different lengths, but they are actually the same length.
These perceptual differences were consistent with differences in the types of environmental features experienced on a regular basis by people in a given cultural context. People in Western cultures, for example, have a perceptual context of buildings with straight lines, what Segall’s study called a carpentered world (Segall et al., 1966). In contrast, people from certain non-Western cultures with an uncarpentered view, such as the Zulu of South Africa, whose villages are made up of round huts arranged in circles, are less susceptible to this illusion (Segall et al., 1999). It is not just vision that is affected by cultural factors. Indeed, research has demonstrated that the ability to identify an odor, and rate its pleasantness and its intensity, varies cross-culturally (Ayabe-Kanamura, Saito, Distel, Martínez-Gómez, & Hudson, 1998).
Children described as thrill seekers are more likely to show taste preferences for intense sour flavors (Liem, Westerbeek, Wolterink, Kok, & de Graaf, 2004), which suggests that basic aspects of personality might affect perception. Furthermore, individuals who hold positive attitudes toward reduced-fat foods are more likely to rate foods labeled as reduced fat as tasting better than people who have less positive attitudes about these products (Aaron, Mela, & Evans, 1994).
Waves and Wavelengths
Learning Objectives
By the end of this section, you will be able to:
- Describe important physical features of wave forms
- Show how physical properties of light waves are associated with perceptual experience
- Show how physical properties of sound waves are associated with perceptual experience
Amplitude and Wavelength
Two physical characteristics of a wave are amplitude and wavelength (Figure 5.5). The amplitude of a wave is the distance from the center line to the top point of the crest or the bottom point of the trough. Wavelength refers to the length of a wave from one peak to the next.
Wavelength is directly related to the frequency of a given wave form. Frequency refers to the number of waves that pass a given point in a given time period and is often expressed in terms of hertz (Hz), or cycles per second. Longer wavelengths will have lower frequencies, and shorter wavelengths will have higher frequencies (Figure 5.6).
Light Waves
The visible spectrum is the portion of the larger electromagnetic spectrum that we can see. As Figure 5.7 shows, the electromagnetic spectrum encompasses all of the electromagnetic radiation that occurs in our environment and includes gamma rays, x-rays, ultraviolet light, visible light, infrared light, microwaves, and radio waves. The visible spectrum in humans is associated with wavelengths that range from 380 to 740 nm—a very small distance, since a nanometer (nm) is one billionth of a meter. Other species can detect other portions of the electromagnetic spectrum. For instance, honeybees can see light in the ultraviolet range (Wakakuwa, Stavenga, & Arikawa, 2007), and some snakes can detect infrared radiation in addition to more traditional visual light cues (Chen, Deng, Brauth, Ding, & Tang, 2012; Hartline, Kass, & Loop, 1978).
Sound Waves
Like light waves, the physical properties of sound waves are associated with various aspects of our perception of sound. The frequency of a sound wave is associated with our perception of that sound’s pitch. High-frequency sound waves are perceived as high-pitched sounds, while low-frequency sound waves are perceived as low-pitched sounds. The audible range of sound frequencies is between 20 and 20000 Hz, with greatest sensitivity to those frequencies that fall in the middle of this range.
As was the case with the visible spectrum, other species show differences in their audible ranges. For instance, chickens have a very limited audible range, from 125 to 2000 Hz. Mice have an audible range from 1000 to 91000 Hz, and the beluga whale’s audible range is from 1000 to 123000 Hz. Our pet dogs and cats have audible ranges of about 70–45000 Hz and 45–64000 Hz, respectively (Strain, 2003).
The loudness of a given sound is closely associated with the amplitude of the sound wave. Higher amplitudes are associated with louder sounds. Loudness is measured in terms of decibels (dB), a logarithmic unit of sound intensity. A typical conversation would correlate with 60 dB; a rock concert might check in at 120 dB (Figure 5.9). A whisper 5 feet away or rustling leaves are at the low end of our hearing range; sounds like a window air conditioner, a normal conversation, and even heavy traffic or a vacuum cleaner are within a tolerable range.
Very loud sounds, those in the 80 dB to 130 dB range can cause hearing damage: These are sounds of a food processor, power lawnmower, heavy truck (25 feet away), subway train (20 feet away), live rock music, and a jackhammer. The threshold for pain is about 130 dB, a jet plane taking off or a revolver firing at close range (Dunkle, 1982).
About one-third of all hearing loss is due to noise exposure, and the louder the sound, the shorter the exposure needed to cause hearing damage (Le, Straatman, Lea, & Westerberg, 2017). For example, listening to music through earbuds at maximum volume (around 100–105 decibels) can cause noise-induced hearing loss after 15 minutes of exposure. Over time, listening to loud music increases the risk of age-related hearing loss (Kujawa & Liberman, 2006).
Of course, different musical instruments can play the same musical note at the same level of loudness, yet they still sound quite different. This is known as the timbre of a sound. Timbre refers to a sound’s purity, and it is affected by the complex interplay of frequency, amplitude, and timing of sound waves.
The Visual System
Learning Objectives
By the end of this section, you will be able to:
- Describe the basic anatomy of the visual system
- Discuss how rods and cones contribute to different aspects of vision
- Describe how monocular and binocular cues are used in the perception of depth
The visual system constructs a mental representation of the world around us (Figure 5.10). This contributes to our ability to successfully navigate through physical space and interact with important individuals and objects in our environments. This section will provide an overview of the basic anatomy and function of the visual system. In addition, we will explore our ability to perceive color and depth.
Anatomy of the Visual System
The eye is the major sensory organ involved in vision (Figure 5.11). Light waves are transmitted across the cornea and enter the eye through the pupil. The cornea is the transparent covering over the eye. It serves as a barrier between the inner eye and the outside world, and it is involved in focusing light waves that enter the eye through the pupil. The pupil is the small opening in the eye through which light passes, and the size of the pupil can change as a function of light levels as well as emotional arousal. The pupil’s size is controlled by muscles that are connected to the iris, which is the colored portion of the eye. When light levels are low, the iris shrinks and the pupil becomes dilated, or expanded, to allow more light to enter the eye. When light levels are high, the iris grows larger and the pupil will constrict, or become smaller, to reduce the amount of light that enters the eye.
After passing through the pupil, light crosses the lens, a curved, transparent structure that serves to provide additional focus. The lens is attached to muscles that can change its shape to aid in focusing light that is reflected from near or far objects. In a normal-sighted individual, the lens will focus images perfectly on a small indentation in the back of the eye known as the fovea, which is part of the retina, the light-sensitive lining of the eye. The fovea contains densely packed specialized photoreceptor cells (Figure 5.12). These photoreceptor cells, known as cones, are light-detecting cells. The cones are specialized types of photoreceptors that work best in bright light conditions. Cones are very sensitive to acute detail and provide tremendous spatial resolution. They also are directly involved in our ability to perceive color.
While cones are concentrated in the fovea, where images tend to be focused, rods, another type of photoreceptor, are located throughout the remainder of the retina. Rods are specialized photoreceptors that work well in low light conditions, and while they lack the spatial resolution and color function of the cones, they are involved in our vision in dimly lit environments as well as in our perception of movement on the periphery of our visual field.
We have all experienced the different sensitivities of rods and cones when making the transition from a brightly lit environment to a dimly lit environment. Imagine going to see a blockbuster movie on a clear summer day. As you walk from the brightly lit lobby into the dark theater, you notice that you immediately have difficulty seeing much of anything. After a few minutes, you begin to adjust to the darkness and can see the interior of the theater. In the bright environment, your vision was dominated primarily by cone activity. As you move to the dark environment, rod activity dominates, but there is a delay in transitioning between the phases. If your rods do not transform light into nerve impulses as easily and efficiently as they should, you will have difficulty seeing in dim light, a condition known as night blindness.
Rods and cones are connected (via several interneurons) to retinal ganglion cells. Axons from the retinal ganglion cells converge and exit through the back of the eye to form the optic nerve. The optic nerve carries visual information from the retina to the brain. There is a point in the visual field called the blind spot: Even when light from a small object is focused on the blind spot, we do not see it. We are not consciously aware of our blind spots for two reasons: First, each eye gets a slightly different view of the visual field; therefore, the blind spots do not overlap. Second, our visual system fills in the blind spot so that although we cannot respond to visual information that occurs in that portion of the visual field, we are also not aware that information is missing.
Try these labeling exercises (and don’t cheat!)
The optic nerve from each eye merges just below the brain at a point called the optic chiasm. As Figure 5.13 shows, the optic chiasm is an X-shaped structure that sits just below the cerebral cortex at the front of the brain. At the point of the optic chiasm, information from the right visual field (which comes from both eyes) is sent to the left side of the brain, and information from the left visual field is sent to the right side of the brain.
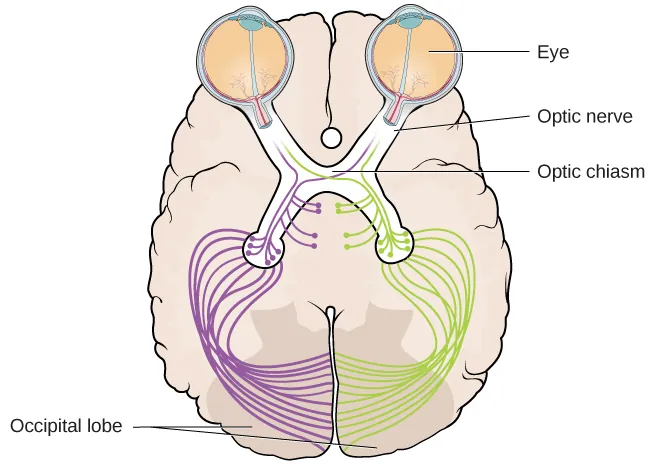
Once inside the brain, visual information is sent via a number of structures to primary visual cortex in the occipital lobe. Visual information is processed in parallel pathways which can generally be described as the “what pathway” and the “where/how” pathway. The “what pathway” is involved in object recognition and identification and primarily relies on regions in the temporal lobe. The “where/how pathway” is involved with objects’ location in space and how one might interact with a particular visual stimulus (Milner & Goodale, 2008; Ungerleider & Haxby, 1994). The where/how pathway relies on regions of the parietal lobe. When you see a ball rolling down the street, the “what pathway” identifies what the object is, and the “where/how pathway” identifies its location and movement in space.
WHAT DO YOU THINK? The Ethics of Research Using Animals
David Hubel and Torsten Wiesel were awarded the Nobel Prize in Medicine in 1981 for their research on the visual system. They collaborated for more than twenty years and made significant discoveries about the neurology of visual perception (Hubel & Wiesel, 1959, 1962, 1963, 1970; Wiesel & Hubel, 1963). They studied animals, mostly cats and monkeys. Although they used several techniques, they did considerable single unit recordings, during which tiny electrodes were inserted in the animal’s brain to determine when a single cell was activated. Among their many discoveries, they found that specific brain cells respond to lines with specific orientations (called ocular dominance), and they mapped the way those cells are arranged in areas of the visual cortex known as columns and hypercolumns.
In some of their research, they sutured one eye of newborn kittens closed and followed the development of the kittens’ vision. They discovered there was a critical period of development for vision. If kittens were deprived of input from one eye, other areas of their visual cortex filled in the area that was normally used by the eye that was sewn closed. In other words, neural connections that exist at birth can be lost if they are deprived of sensory input.
What do you think about sewing a kitten’s eye closed for research? To many animal advocates, this would seem brutal, abusive, and unethical. What if you could do research that would help ensure babies and children born with certain conditions could develop normal vision instead of becoming blind? Would you want that research done? Would you conduct that research, even if it meant causing some harm to cats? Would you think the same way if you were the parent of such a child? What if you worked at the animal shelter?
Like virtually every other industrialized nation, the United States permits medical experimentation on animals, with few limitations (assuming sufficient scientific justification). The goal of any laws that exist is not to ban such tests but rather to limit unnecessary animal suffering by establishing standards for the humane treatment and housing of animals in laboratories.
As explained by Stephen Latham, the director of the Interdisciplinary Center for Bioethics at Yale (2012), possible legal and regulatory approaches to animal testing vary on a continuum from strong government regulation and monitoring of all experimentation at one end, to a self-regulated approach that depends on the ethics of the researchers at the other end. The United Kingdom has the most significant regulatory scheme, whereas Japan uses the self-regulation approach. The U.S. approach is somewhere in the middle, the result of a gradual blending of the two approaches.
There is no question that medical research is a valuable and important practice. The question is whether the use of animals is a necessary or even best practice for producing the most reliable results. Alternatives include the use of patient-drug databases, virtual drug trials, computer models and simulations, and noninvasive imaging techniques such as magnetic resonance imaging and computed tomography scans (“Animals in Science/Alternatives,” n.d.). Other techniques, such as microdosing, use humans not as test animals but as a means to improve the accuracy and reliability of test results. In vitro methods based on human cell and tissue cultures, stem cells, and genetic testing methods are also increasingly available.
Today, at the local level, any facility that uses animals and receives federal funding must have an Institutional Animal Care and Use Committee (IACUC) that ensures that the NIH guidelines are being followed. The IACUC must include researchers, administrators, a veterinarian, and at least one person with no ties to the institution: that is, a concerned citizen. This committee also performs inspections of laboratories and protocols.
Color and Depth Perception
We do not see the world in black and white; neither do we see it as two-dimensional (2-D) or flat (just height and width, no depth). Let’s look at how color vision works and how we perceive three dimensions (height, width, and depth).
Color Vision
Normal-sighted individuals have three different types of cones that mediate color vision. Each of these cone types is maximally sensitive to a slightly different wavelength of light. According to the trichromatic theory of color vision, shown in Figure 5.14, all colors in the spectrum can be produced by combining red, green, and blue. The three types of cones are each receptive to one of the colors.
CONNECT THE CONCEPTS
Colorblindness: A Personal Story
Several years ago, I dressed to go to a public function and walked into the kitchen where my 7-year-old daughter sat. She looked up at me, and in her most stern voice, said, “You can’t wear that.” I asked, “Why not?” and she informed me the colors of my clothes did not match. She had complained frequently that I was bad at matching my shirts, pants, and ties, but this time, she sounded especially alarmed. As a single father with no one else to ask at home, I drove us to the nearest convenience store and asked the store clerk if my clothes matched. She said my pants were a bright green color, my shirt was a reddish-orange, and my tie was brown. She looked at my quizzically and said, “No way do your clothes match.” Over the next few days, I started asking my coworkers and friends if my clothes matched. After several days of being told that my coworkers just thought I had “a really unique style,” I made an appointment with an eye doctor and was tested (Figure 5.15). It was then that I found out that I was colorblind. I cannot differentiate between most greens, browns, and reds. Fortunately, other than unknowingly being badly dressed, my colorblindness rarely harms my day-to-day life.
Some forms of color deficiency are rare. Seeing in grayscale (only shades of black and white) is extremely rare, and some people who do so only have rods, which means they also have very low visual acuity. The most common X-linked inherited abnormality is red-green color blindness (Birch, 2012). Individuals with red-green colorblindness struggle to differentiate between reds and greens. Approximately 8% of males with European Caucasian descent, 5% of Asian males, 4% of African males, and less than 2% of indigenous American males, Australian males, and Polynesian males have red-green color deficiency (Birch, 2012). Comparatively, only about 0.4% of females from European Caucasian descent have red-green color deficiency (Birch, 2012).

Another major theory of color vision is known as the opponent-process theory. According to this theory, color is coded in opponent pairs: black-white, yellow-blue, and green-red. The basic idea is that some cells of the visual system are excited by one of the opponent colors and inhibited by the other. So, a cell that was excited by wavelengths associated with green would be inhibited by wavelengths associated with red, and vice versa. One of the implications of opponent processing is that we do not experience greenish-reds or yellowish-blues as colors. Another implication is that this leads to the experience of negative afterimages. An afterimage describes the continuation of a visual sensation after removal of the stimulus.
For example, when you stare briefly at a bright light and then look away from it, you may perceive a spot of darkness where the light was in your visual field. When color is involved in the stimulus, the color pairings identified in the opponent-process theory lead to a negative afterimage. You can test this concept using the flag in Figure 5.16.
The trichromatic theory of color vision and the opponent-process theory are not mutually exclusive. Research has shown that the two theories apply to different levels of the nervous system. Trichromatic theory describes the cone cells in our retina: we have three cone types that are responsive to three different wavelengths that represent red, blue, and green. Once the signal moves past the cones on its way to the brain, other neurons respond in a way consistent with opponent-process theory (Land, 1959; Kaiser, 1997).
Depth Perception
Our ability to perceive spatial relationships in three-dimensional (3-D) space is known as depth perception. With depth perception, we can describe things as being in front, behind, above, below, or to the side of other things.
We use a variety of cues in a visual scene to establish our sense of depth. Some of these are binocular cues, which means that they rely on the use of both eyes. The basis of binocular depth cues is binocular disparity, the slightly different view of the world that each of our eyes receives. To experience this slightly different view, do this simple exercise: extend your arm fully and extend one of your fingers and focus on that finger. Now, close your left eye without moving your head, then open your left eye and close your right eye without moving your head. You will notice that your finger seems to shift as you alternate between the two eyes because of the slightly different view each eye has of your finger.
A 3-D movie works on the same principle: the special glasses you wear allow the two slightly different images projected onto the screen to be seen separately by your left and your right eye. As your brain processes these images, you have the illusion that the leaping animal or running person is coming right toward you.
Although we rely on binocular cues to experience depth in our 3-D world, we can also perceive depth in 2-D arrays. Think about all the paintings and photographs you have seen. Generally, you pick up on depth in these images even though the visual stimulus is 2-D. When we do this, we are relying on a number of monocular cues, or cues that require only one eye. If you think you can’t see depth with one eye, note that you don’t bump into things when using only one eye while walking—and, in fact, we have more monocular cues than binocular cues.
Monocular depth cues include occlusion (a nearer object blocks our view of a farther object), relative size (objects appear larger when they are nearby and smaller when they are further away), and linear perspective. Linear perspective refers to the fact that parallel lines seem to converge in depth (Figure 5.17). You might recognize the idea of linear perspective from art class where it is called a vanishing point. Many artists use linear perspective/vanishing points to establish depth in their works.
DIG DEEPER: Stereoblindness
Bruce Bridgeman was born with an extreme case of lazy eye that resulted in him being stereoblind, or unable to respond to binocular cues of depth. He relied heavily on monocular depth cues, but he never had a true appreciation of the 3-D nature of the world around him. This all changed one night in 2012 while Bruce was seeing a movie with his wife.
The movie the couple was going to see was shot in 3-D, and even though he thought it was a waste of money, Bruce paid for the 3-D glasses when he purchased his ticket. As soon as the film began, Bruce put on the glasses and experienced something completely new. For the first time in his life he appreciated the true depth of the world around him. Remarkably, his ability to perceive depth persisted outside of the movie theater.
There are cells in the nervous system that respond to binocular depth cues. Normally, these cells require activation during early development in order to persist, so experts familiar with Bruce’s case (and others like his) assume that at some point in his development, Bruce must have experienced at least a fleeting moment of binocular vision. It was enough to ensure the survival of the cells in the visual system tuned to binocular cues. The mystery now is why it took Bruce nearly 70 years to have these cells activated (Peck, 2012).
The Auditory System
Learning Objectives
- Describe the basic anatomy and function of the auditory system
- Explain how we encode and perceive pitch
- Discuss how we localize sound
Our auditory system converts pressure waves into meaningful sounds. This translates into our ability to hear the sounds of nature, to appreciate the beauty of music, and to communicate with one another through spoken language. This section will provide an overview of the basic anatomy and function of the auditory system. It will include a discussion of how the sensory stimulus is translated into neural impulses, where in the brain that information is processed, how we perceive pitch, and how we know where sound is coming from.
Anatomy of the Auditory System
The ear can be separated into three sections: the outer, middle, and inner ear. The outer ear includes the pinna, which is the visible part of the ear that protrudes from our heads, the auditory canal, and the tympanic membrane, or eardrum. The middle ear contains three tiny bones known as the ossicles, which are named the malleus (or hammer), incus (or anvil), and the stapes (or stirrup). The inner ear contains the semi-circular canals, which are involved in balance and movement (the vestibular sense), and the cochlea. The cochlea is a fluid-filled, snail-shaped structure that contains the sensory receptor cells (hair cells) of the auditory system (Figure 5.18).
Sound waves travel along the auditory canal and strike the tympanic membrane, causing it to vibrate. This vibration results in movement of the three ossicles. As the ossicles move, the stapes presses into a thin membrane of the cochlea known as the oval window. As the stapes presses into the oval window, the fluid inside the cochlea begins to move, eventually stimulating auditory receptor cells called hair cells. Hair cells do not grow hairs. Instead, they are called hair cells because they have thin projections of their cell membranes, called stereocilia, that look like hair (Figure 5.19).

The activation of hair cells is a mechanical process. When the stereocilia of a hair cell bend from sound waves traveling through the cochlea, the hair cell becomes activated and stimulates the auditory nerve. Action potentials in the auditory nerve travel to the brain. Auditory information is shuttled to the inferior colliculus, the medial geniculate nucleus of the thalamus, and finally to the auditory cortex in the temporal lobe of the brain for processing. Like the visual system, there is also evidence suggesting that information about auditory recognition and localization is processed in parallel streams (Rauschecker & Tian, 2000; Renier et al., 2009).
Pitch Perception
Different frequencies of sound waves are associated with differences in our perception of the pitch of those sounds. Low-frequency sounds are lower pitched, and high-frequency sounds are higher pitched. How does the auditory system differentiate among various pitches?
The place theory of pitch perception suggests that different portions of the cochlea are sensitive to sounds of different frequencies. More specifically, hair cells in the base of the cochlea (nearest the stapes and oval window) respond best to high frequencies and hair cells near the tip of the cochlea respond best to low frequencies (Shamma, 2001).
Hearing Loss
Deafness is the partial or complete inability to hear. Some people are born without hearing, which is known as congenital deafness. Other people suffer from conductive hearing loss, which is due to a problem delivering sound energy to the cochlea. Causes for conductive hearing loss include blockage of the ear canal, a hole in the tympanic membrane, problems with the ossicles, or fluid in the space between the eardrum and cochlea. Another group of people suffer from sensorineural hearing loss, which is the most common form of hearing loss. Sensorineural hearing loss can be caused by many factors, such as aging, head or acoustic trauma, infections and diseases (such as measles or mumps), medications, environmental effects such as noise exposure (noise-induced hearing loss, as shown in Figure 5.20), tumors, and toxins (such as those found in certain solvents and metals).
Given the mechanical nature by which the sound wave stimulus is transmitted from the eardrum through the ossicles to the oval window of the cochlea, some degree of hearing loss is inevitable. With conductive hearing loss, hearing problems are associated with a failure in the vibration of the eardrum and/or movement of the ossicles. These problems are often dealt with through devices like hearing aids that amplify incoming sound waves to make vibration of the eardrum and movement of the ossicles more likely to occur.
When the hearing problem is associated with a failure to transmit neural signals from the cochlea to the brain, it is called sensorineural hearing loss. One disease that results in sensorineural hearing loss is Ménière’s disease. Although not well understood, Ménière’s disease results in a degeneration of inner ear structures that can lead to hearing loss, tinnitus (constant ringing or buzzing), vertigo (a sense of spinning), and an increase in pressure within the inner ear (Semaan & Megerian, 2011). This kind of loss cannot be treated with hearing aids, but some individuals might be candidates for a cochlear implant as a treatment option. Cochlear implants are electronic devices that consist of a microphone, a speech processor, and an electrode array. The device receives incoming sound information and directly stimulates the auditory nerve to transmit information to the brain.
WHAT DO YOU THINK? Deaf Culture
In the United States and other places around the world, deaf people have their own language, schools, and customs. This is called deaf culture. In the United States, deaf individuals often communicate using American Sign Language (ASL); ASL has no verbal component and is based entirely on visual signs and gestures. The primary mode of communication is signing. One of the values of deaf culture is to continue traditions like using sign language rather than teaching deaf children to try to speak, read lips, or have cochlear implant surgery.
When a child is diagnosed as deaf, parents have difficult decisions to make. Should the child be enrolled in mainstream schools and taught to verbalize and read lips? Or should the child be sent to a school for deaf children to learn ASL and have significant exposure to deaf culture? Do you think there might be differences in the way that parents approach these decisions depending on whether or not they are also deaf?
The Other Senses
Learning Objectives
By the end of this section, you will be able to:
- Describe the basic functions of the chemical senses
- Explain the basic functions of the somatosensory, nociceptive, and thermoceptive sensory systems
- Describe the basic functions of the vestibular, proprioceptive, and kinesthetic sensory systems
Vision and hearing have received an incredible amount of attention from researchers over the years. While there is still much to be learned about how these sensory systems work, we have a much better understanding of them than of our other sensory modalities. In this section, we will explore our chemical senses (taste and smell) and our body senses (touch, temperature, pain, balance, and body position).
The Chemical Senses
Taste (gustation) and smell (olfaction) are called chemical senses because both have sensory receptors that respond to molecules in the food we eat or in the air we breathe. There is a pronounced interaction between our chemical senses. For example, when we describe the flavor of a given food, we are really referring to both gustatory and olfactory properties of the food working in combination.
Taste (Gustation)
You have learned since elementary school that there are four basic groupings of taste: sweet, salty, sour, and bitter. Research demonstrates, however, that we have at least six taste groupings. Umami is our fifth taste. Umami is actually a Japanese word that roughly translates to yummy, and it is associated with a taste for monosodium glutamate (Kinnamon & Vandenbeuch, 2009). There is also a growing body of experimental evidence suggesting that we possess a taste for the fatty content of a given food (Mizushige, Inoue, & Fushiki, 2007).
Molecules from the food and beverages we consume dissolve in our saliva and interact with taste receptors on our tongue and in our mouth and throat. Taste buds are formed by groupings of taste receptor cells with hair-like extensions that protrude into the central pore of the taste bud (Figure 5.21). Taste buds have a life cycle of ten days to two weeks, so even destroying some by burning your tongue won’t have any long-term effect; they just grow right back. Taste molecules bind to receptors on this extension and cause chemical changes within the sensory cell that result in neural impulses being transmitted to the brain via different nerves, depending on where the receptor is located. Taste information is transmitted to the medulla, thalamus, and limbic system, and to the gustatory cortex, which is tucked underneath the overlap between the frontal and temporal lobes (Maffei, Haley, & Fontanini, 2012; Roper, 2013).
Smell (Olfaction)
Olfactory receptor cells are located in a mucous membrane at the top of the nose. Small hair-like extensions from these receptors serve as the sites for odor molecules dissolved in the mucus to interact with chemical receptors located on these extensions (Figure 5.22). Once an odor molecule has bound a given receptor, chemical changes within the cell result in signals being sent to the olfactory bulb: a bulb-like structure at the tip of the frontal lobe where the olfactory nerves begin. From the olfactory bulb, information is sent to regions of the limbic system and to the primary olfactory cortex, which is located very near the gustatory cortex (Lodovichi & Belluscio, 2012; Spors et al., 2013).
There is tremendous variation in the sensitivity of the olfactory systems of different species. We often think of dogs as having far superior olfactory systems than our own, and indeed, dogs can do some remarkable things with their noses. There is some evidence to suggest that dogs can “smell” dangerous drops in blood glucose levels as well as cancerous tumors (Wells, 2010). Dogs’ extraordinary olfactory abilities may be due to the increased number of functional genes for olfactory receptors (between 800 and 1200), compared to the fewer than 400 observed in humans and other primates (Niimura & Nei, 2007).
Many species respond to chemical messages, known as pheromones, sent by another individual (Wysocki & Preti, 2004). Pheromonal communication often involves providing information about the reproductive status of a potential mate. So, for example, when a female rat is ready to mate, she secretes pheromonal signals that draw attention from nearby male rats. Pheromonal activation is actually an important component in eliciting sexual behavior in the male rat (Furlow, 1996, 2012; Purvis & Haynes, 1972; Sachs, 1997). There has also been a good deal of research (and controversy) about pheromones in humans (Comfort, 1971; Russell, 1976; Wolfgang-Kimball, 1992; Weller, 1998). Thus far, there is little evidence that humans respond to pheromone signals.
Touch, Thermoception, and Nociception
A number of receptors are distributed throughout the skin to respond to various touch-related stimuli (Figure 5.23). The receptors responsible for fine touch perception in your hands include Meissner’s corpuscles, Pacinian corpuscles, Merkel’s disks, and Ruffini corpuscles. Meissner’s corpuscles respond to pressure and lower frequency vibrations, and Pacinian corpuscles detect transient pressure and higher frequency vibrations. Merkel’s disks respond to light pressure, while Ruffini corpuscles detect stretch (Abraira & Ginty, 2013). These receptors work together to help you identify information like the texture of an object you are touching and whether something you are holding is falling from your grasp.
In addition to the receptors located in the skin, there are also a number of free nerve endings that serve sensory functions. These nerve endings respond to a variety of different types of touch-related stimuli and serve as sensory receptors for both thermoception (temperature perception) and nociception (a signal indicating potential harm and maybe pain) (Garland, 2012; Petho & Reeh, 2012; Spray, 1986). Sensory information collected from the receptors and free nerve endings travels up the spinal cord and is transmitted to regions of the medulla, thalamus, and ultimately to somatosensory cortex, which is located in the postcentral gyrus of the parietal lobe.
Pain Perception
Pain is an unpleasant experience that involves both physical and psychological components. Feeling pain is quite adaptive because it makes us aware of an injury, and it motivates us to remove ourselves from the cause of that injury. In addition, pain also makes us less likely to suffer additional injury because we will be gentler with our injured body parts.
Generally speaking, pain can be considered to be neuropathic or inflammatory in nature. Pain that signals some type of tissue damage is known as inflammatory pain. In some situations, pain results from damage to neurons of either the peripheral or central nervous system. As a result, pain signals that are sent to the brain get exaggerated. This type of pain is known as neuropathic pain. Multiple treatment options for pain relief range from relaxation therapy to the use of analgesic medications to deep brain stimulation. The most effective treatment option for a given individual will depend on a number of considerations, including the severity and persistence of the pain and any medical/psychological conditions.
Some individuals are born without the ability to feel pain. This very rare genetic disorder is known as congenital insensitivity to pain (or congenital analgesia). While those with congenital analgesia can detect differences in temperature and pressure, they cannot experience pain. As a result, they often suffer significant injuries. Young children have serious mouth and tongue injuries because they have bitten themselves repeatedly. Not surprisingly, individuals suffering from this disorder have much shorter life expectancies due to their injuries and secondary infections of injured sites (U.S. National Library of Medicine, 2013).
The Vestibular Sense, Proprioception, and Kinesthesia
The vestibular sense contributes to our ability to maintain balance and body posture. As Figure 5.24 shows, the major sensory organs (utricle, saccule, and the three semicircular canals) of this system are located next to the cochlea in the inner ear. The vestibular organs are fluid-filled and have hair cells, similar to the ones found in the auditory system, which respond to movement of the head and gravitational forces. When these hair cells are stimulated, they send signals to the brain via the vestibular nerve. Although we may not be consciously aware of our vestibular system’s sensory information under normal circumstances, its importance is apparent when we experience motion sickness and/or dizziness related to infections of the inner ear (Khan & Chang, 2013).
In addition to maintaining balance, the vestibular system collects information critical for controlling movement and the reflexes that move various parts of our bodies to compensate for changes in body position. Therefore, both proprioception (perception of body position) and kinesthesia (perception of the body’s movement through space) interact with information provided by the vestibular system.
These sensory systems also gather information from receptors that respond to stretch and tension in muscles, joints, skin, and tendons (Lackner & DiZio, 2005; Proske, 2006; Proske & Gandevia, 2012). Proprioceptive and kinesthetic information travels to the brain via the spinal column. Several cortical regions in addition to the cerebellum receive information from and send information to the sensory organs of the proprioceptive and kinesthetic systems.
DIG DEEPER: The Depths of Perception: Bias, Prejudice, and Cultural Factors
In this chapter, you have learned that perception is a complex process. Built from sensations, but influenced by our own experiences, biases, prejudices, and cultures, perceptions can be very different from person to person. Research suggests that implicit racial prejudice and stereotypes affect perception. For instance, several studies have demonstrated that non-Black participants identify weapons faster and are more likely to identify non-weapons as weapons when the image of the weapon is paired with the image of a Black person (Payne, 2001; Payne, Shimizu, & Jacoby, 2005). Furthermore, White individuals’ decisions to shoot an armed target in a video game is made more quickly when the target is Black (Correll, Park, Judd, & Wittenbrink, 2002; Correll, Urland, & Ito, 2006). This research is important, considering the number of very high-profile cases in the last few decades in which young Blacks were killed by people who claimed to believe that the unarmed individuals were armed and/or represented some threat to their personal safety.
Chapter Summary
5.1 Sensation vs. Perception
Sensation occurs when sensory receptors detect sensory stimuli. Perception involves the organization, interpretation, and conscious experience of those sensations. All sensory systems have both absolute and difference thresholds, which refer to the minimum amount of stimulus energy or the minimum amount of difference in stimulus energy required to be detected about 50% of the time, respectively. Sensory adaptation, selective attention, and signal detection theory can help explain what is perceived and what is not. In addition, our perceptions are affected by a number of factors, including beliefs, values, prejudices, culture, and life experiences.
5.2 Waves and Wavelengths
Both light and sound can be described in terms of wave forms with physical characteristics like amplitude, wavelength, and timbre. Wavelength and frequency are inversely related so that longer waves have lower frequencies, and shorter waves have higher frequencies. In the visual system, a light wave’s wavelength is generally associated with color, and its amplitude is associated with brightness. In the auditory system, a sound’s frequency is associated with pitch, and its amplitude is associated with loudness.
5.3 Vision
Light waves cross the cornea and enter the eye at the pupil. The eye’s lens focuses this light so that the image is focused on a region of the retina known as the fovea. The fovea contains cones that possess high levels of visual acuity and operate best in bright light conditions. Rods are located throughout the retina and operate best under dim light conditions. Visual information leaves the eye via the optic nerve. Information from each visual field is sent to the opposite side of the brain at the optic chiasm. Visual information then moves through a number of brain sites before reaching the occipital lobe, where it is processed.
Two theories explain color perception. The trichromatic theory asserts that three distinct cone groups are tuned to slightly different wavelengths of light, and it is the combination of activity across these cone types that results in our perception of all the colors we see. The opponent-process theory of color vision asserts that color is processed in opponent pairs and accounts for the interesting phenomenon of a negative afterimage. We perceive depth through a combination of monocular and binocular depth cues.
5.4 Hearing
Sound waves are funneled into the auditory canal and cause vibrations of the eardrum; these vibrations move the ossicles. As the ossicles move, the stapes presses against the oval window of the cochlea, which causes fluid inside the cochlea to move. As a result, hair cells embedded in the basilar membrane become enlarged, which sends neural impulses to the brain via the auditory nerve.
Pitch perception and sound localization are important aspects of hearing. Our ability to perceive pitch relies on both the firing rate of the hair cells in the basilar membrane as well as their location within the membrane. In terms of sound localization, both monaural and binaural cues are used to locate where sounds originate in our environment.
Individuals can be born deaf, or they can develop deafness as a result of age, genetic predisposition, and/or environmental causes. Hearing loss that results from a failure of the vibration of the eardrum or the resultant movement of the ossicles is called conductive hearing loss. Hearing loss that involves a failure of the transmission of auditory nerve impulses to the brain is called sensorineural hearing loss.
5.5 The Other Senses
Taste (gustation) and smell (olfaction) are chemical senses that employ receptors on the tongue and in the nose that bind directly with taste and odor molecules in order to transmit information to the brain for processing. Our ability to perceive touch, temperature, and pain is mediated by a number of receptors and free nerve endings that are distributed throughout the skin and various tissues of the body. The vestibular sense helps us maintain a sense of balance through the response of hair cells in the utricle, saccule, and semi-circular canals that respond to changes in head position and gravity. Our proprioceptive and kinesthetic systems provide information about body position and body movement through receptors that detect stretch and tension in the muscles, joints, tendons, and skin of the body.
5.6 Gestalt Principles of Perception
Gestalt theorists have been incredibly influential in the areas of sensation and perception. Gestalt principles such as figure-ground relationship, grouping by proximity or similarity, the law of good continuation, and closure are all used to help explain how we organize sensory information. Our perceptions are not infallible, and they can be influenced by bias, prejudice, and other factors.
Access for free at https://openstax.org/books/psychology-2e/pages/1-introduction
specialized neurons that respond to specific types of stimuli
the detection of information by a sensory receptor
the conversion from sensory stimulus to action potentials
the minimum amount of stimulus energy that must be present for the stimulus to be detected 50% of the time.
the minimum difference in intensity between two stimuli to detect the difference
Ernst Weber's proposal that the difference threshold is a constant fraction of the original stimulus.
sensory information from a stimulus in the environment driving a process
knowledge and expectancy driving a process
the focusing of mental processing on a particular stimulus
the failure to notice something that is completely visible due to attention being focused elsewhere
the height of a wave form
length of a wave from one peak to the next
the number of waves that pass a given point in a period of time
cycles per second; a measure of the frequency of a waveform
psychological experience of the frequency of a sound wave
psychological experience of the amplitude of a sound wave
the psychological experience of a sound wave's complexity. The reason a saxophone and trombone playing the same note sound different.
the major sensory organ involved in vision
the transparent layer covering the outside front of the eye, protecting the iris and pupil
a small opening in the eye through which light passes
the colored portion of the eye, controls the size of the pupil
a curved, transparent structure behind the pupil that focuses light on the back of the eye
the central portion of the retina, responsible for high acuity, color vision due to high density of cone photoreceptors
the light-sensitive membrane at the back of the eye where phototransduction occurs
light-detecting cells that work best in bright light conditions; provide high acuity and color information
a light sensitive cell primarily found in the retinal periphery, responsible for vision in low-light and motion
neurons in the retina whose axons carry information from the eyes to the brain via the optic nerve
a bundle of neuron axons that carries information from the back of each eye to the thalamus in the brain
the region of the retina without photoreceptors due to the optic nerve leaving the eye
an X-shaped structure below the cerebral cortex where left visual field information crosses over to the right side of the brain, and right visual field information crosses over to the left side of the brain
the first area of the cerebral cortex to receive visual information
visual processing pathway that is responsible for object identification
objects' location in space and how one might interact with a particular visual stimulus; primarily relies on parietal regions
